Table of Contents
Report Components
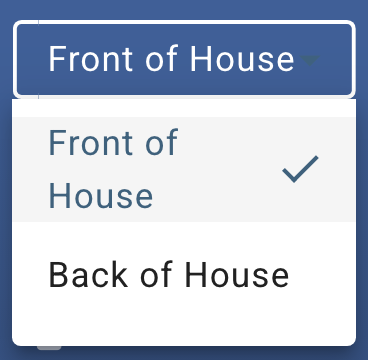
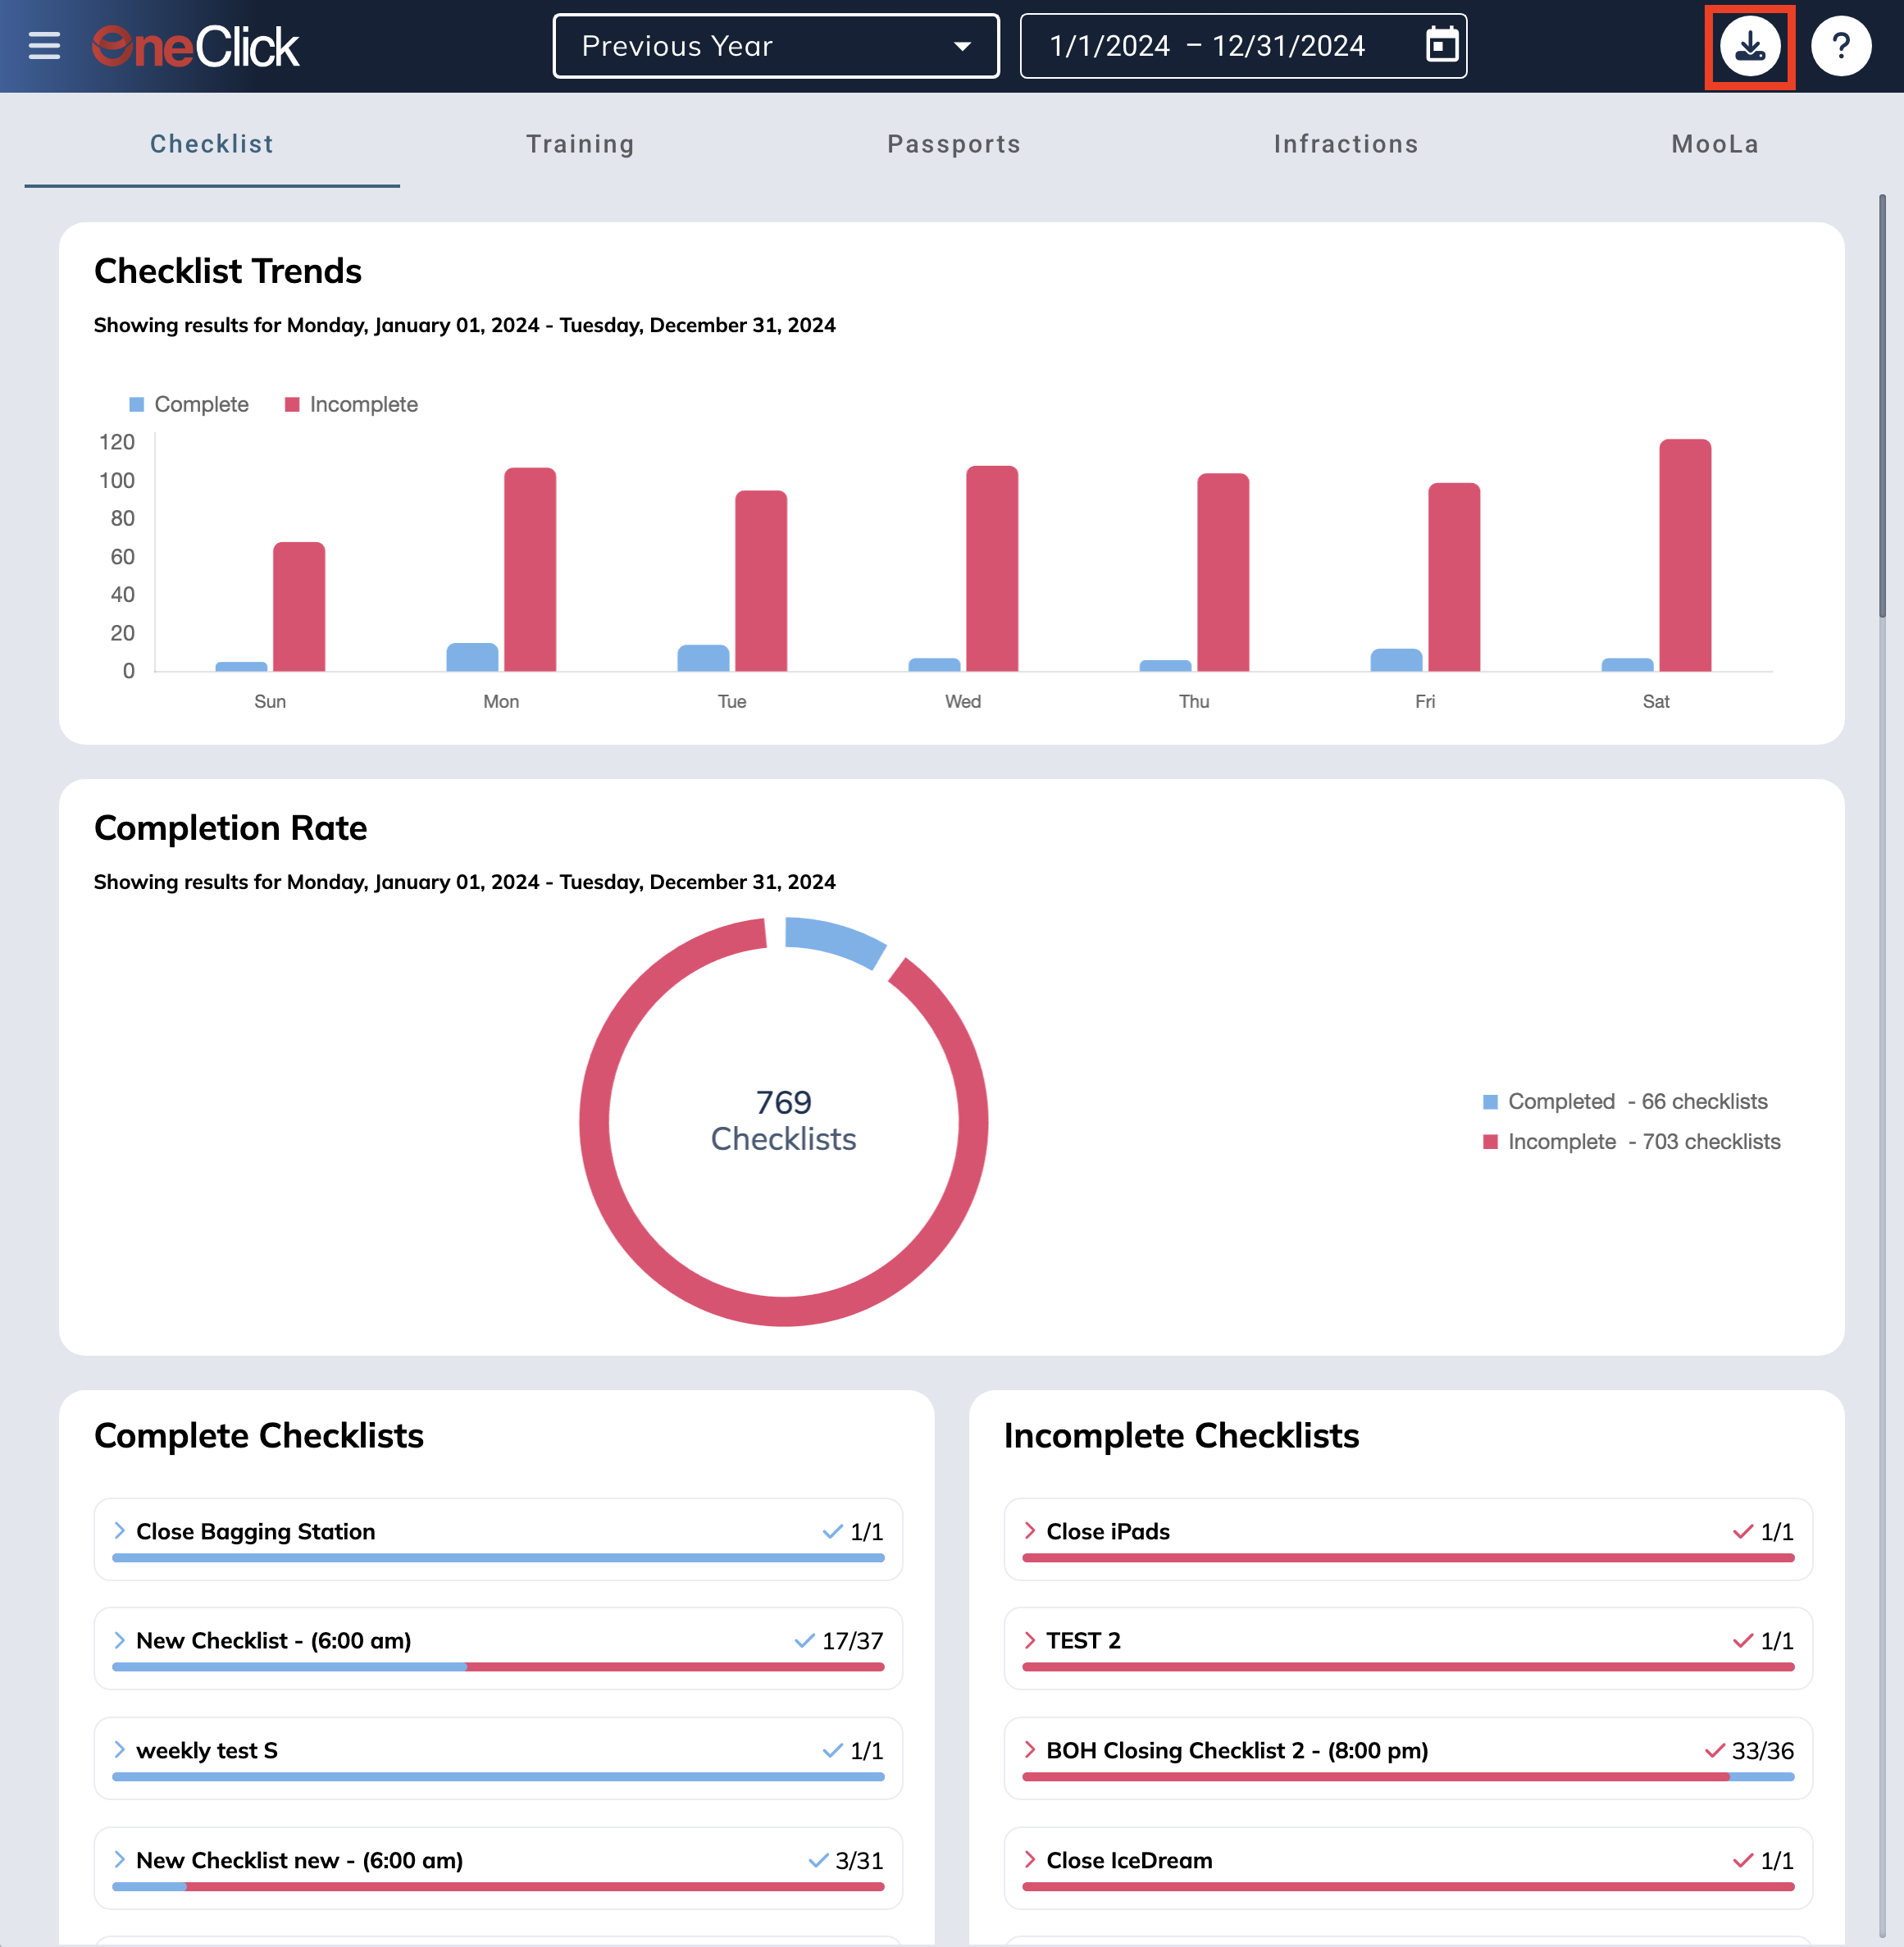
Enhanced Filtering: Filters based on date range, day dropdown, and operation area (Front of House/Back of House) to narrow down reports.
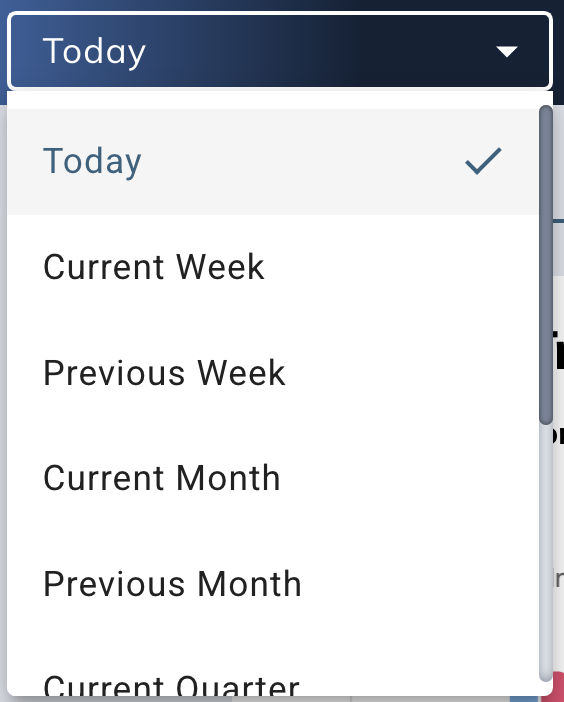
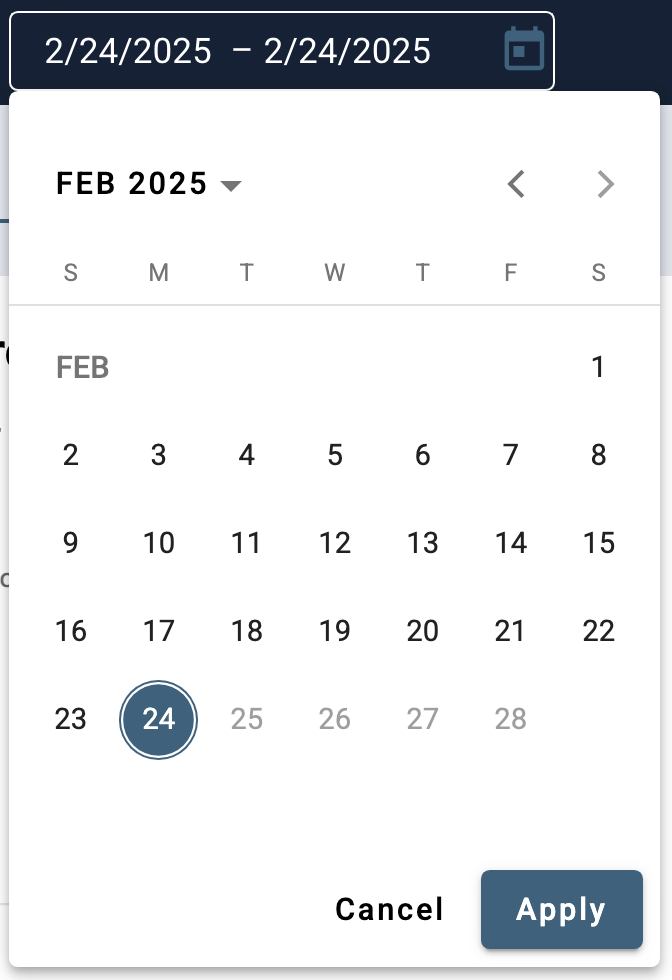
Date Range and Day Filters: Filter reports based on specific time frames or select pre-configured options such as "Today" or "Last 7 Days."
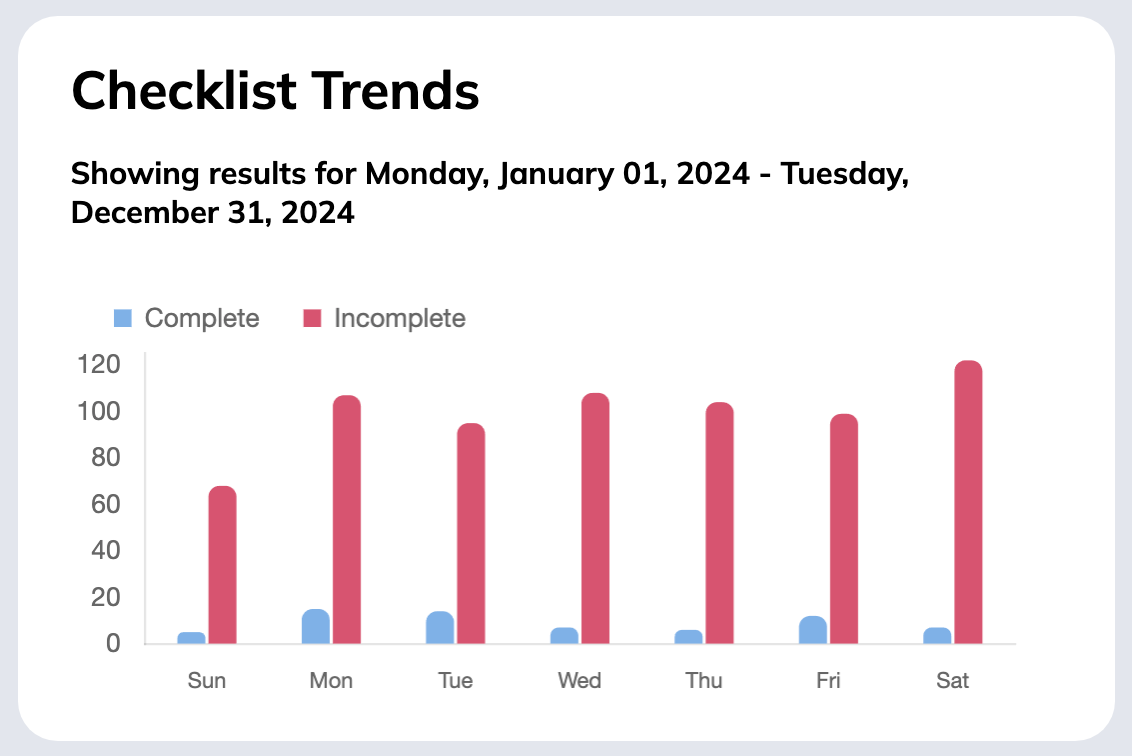
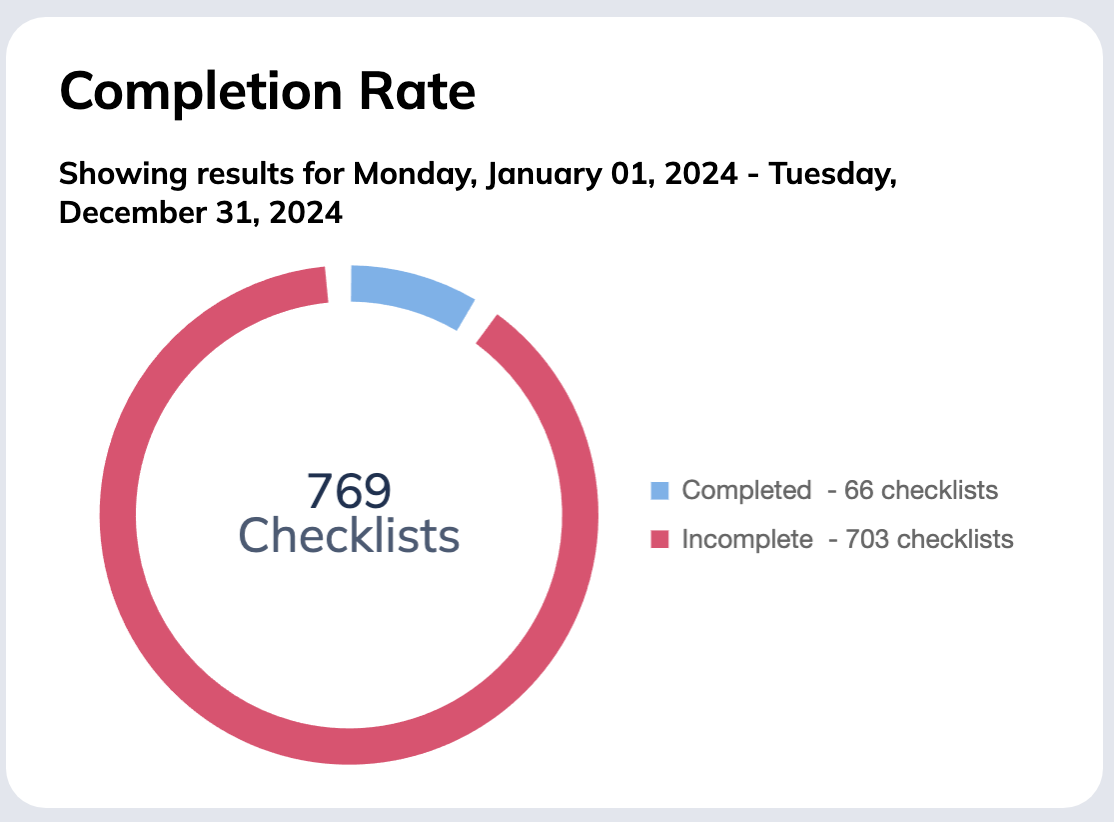
Checklist Trends Column Chart: Displays checklist completion trends over time, allowing users to filter data by checklist type.
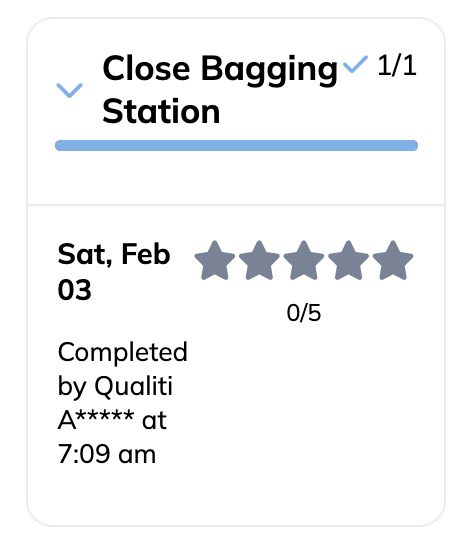
Completed Checklist: A card that shows completion rates via star ratings (0 to 5 stars) for each user.
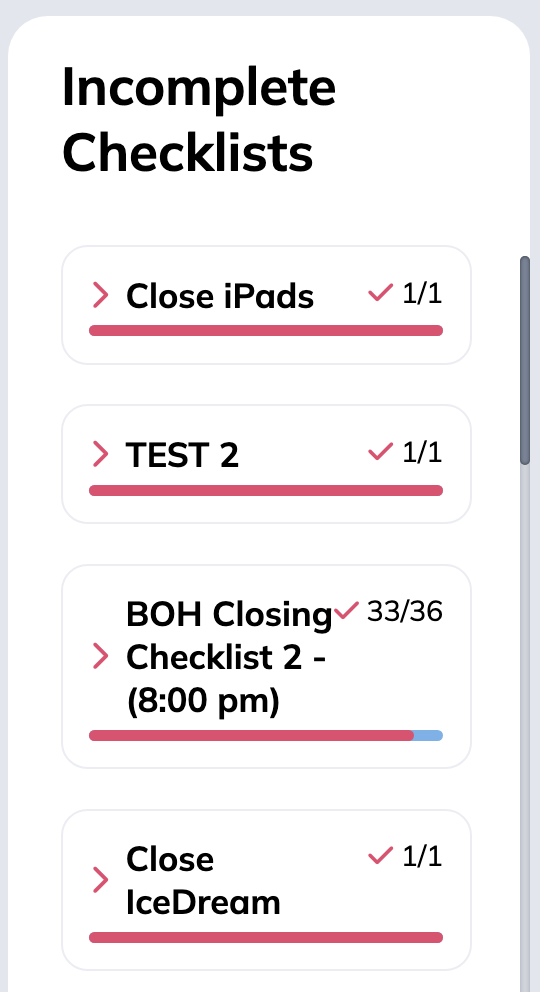
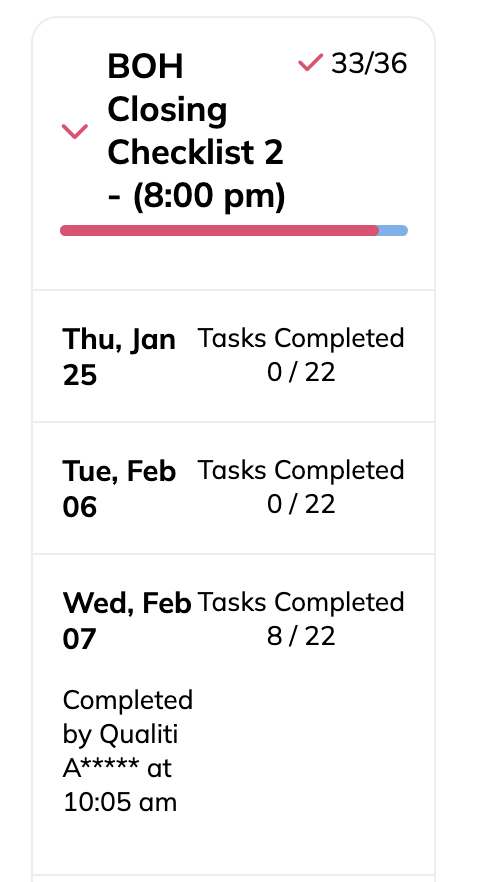
Complete/Incomplete Checklist: Displays users and their incomplete tasks, allowing for real-time status updates from the UI.
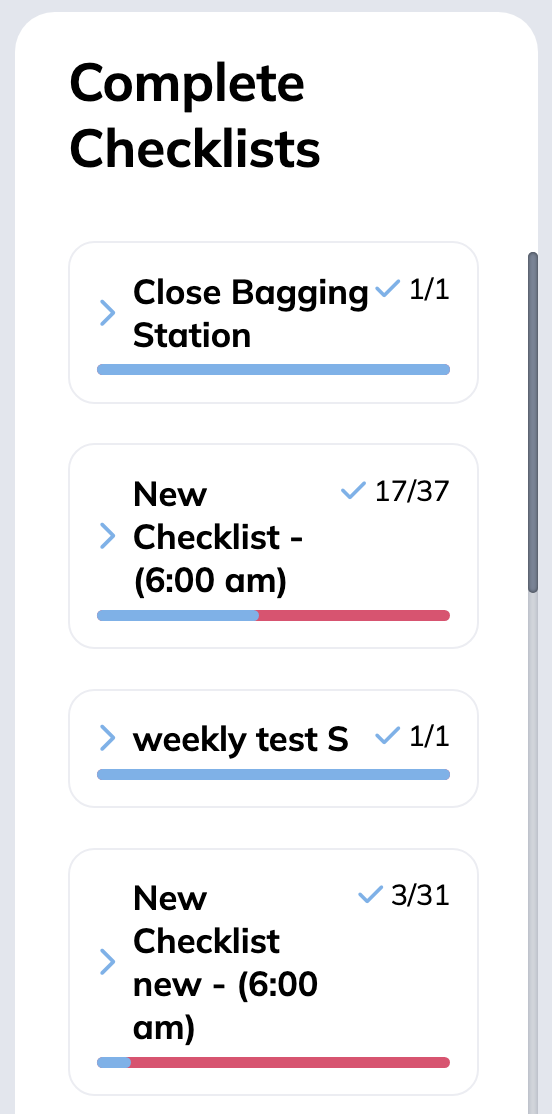
Press the > icon to expand the view of completed and in-completed checklists.
Report Generation
Steps to Generate a Checklist Report
- Navigate to "Reports" then "Checklist" section from the top navigation. Choose the timeframe, then press the Export icon on the top right.
⬇See it in Action!
⬆ Back to TopFAQs
How do I filter reports by specific dates?
Use the Date Range Filter or the Day Dropdown Filter in the checklist section to narrow down reports based on a custom date range or pre-configured periods like "Today" or "Last 7 Days."
Can I track individual performance in checklist reports?
Yes, individual users’ checklist completion is displayed through the Completed Star Level component, where completion rates are visually represented using star ratings.
How can I view incomplete tasks?
Incomplete tasks are displayed on the Incomplete checklist card.
Can I view trends in checklist completion over time?
Yes, use the Report Trends Column Chart to view checklist completion patterns over specific periods. You can adjust the time granularity for a more detailed or aggregated view.